
Dmitrii Usenko
CO-CEO URBAN CARS
d.usenko@urbancars.biz
+233 59 481 7933
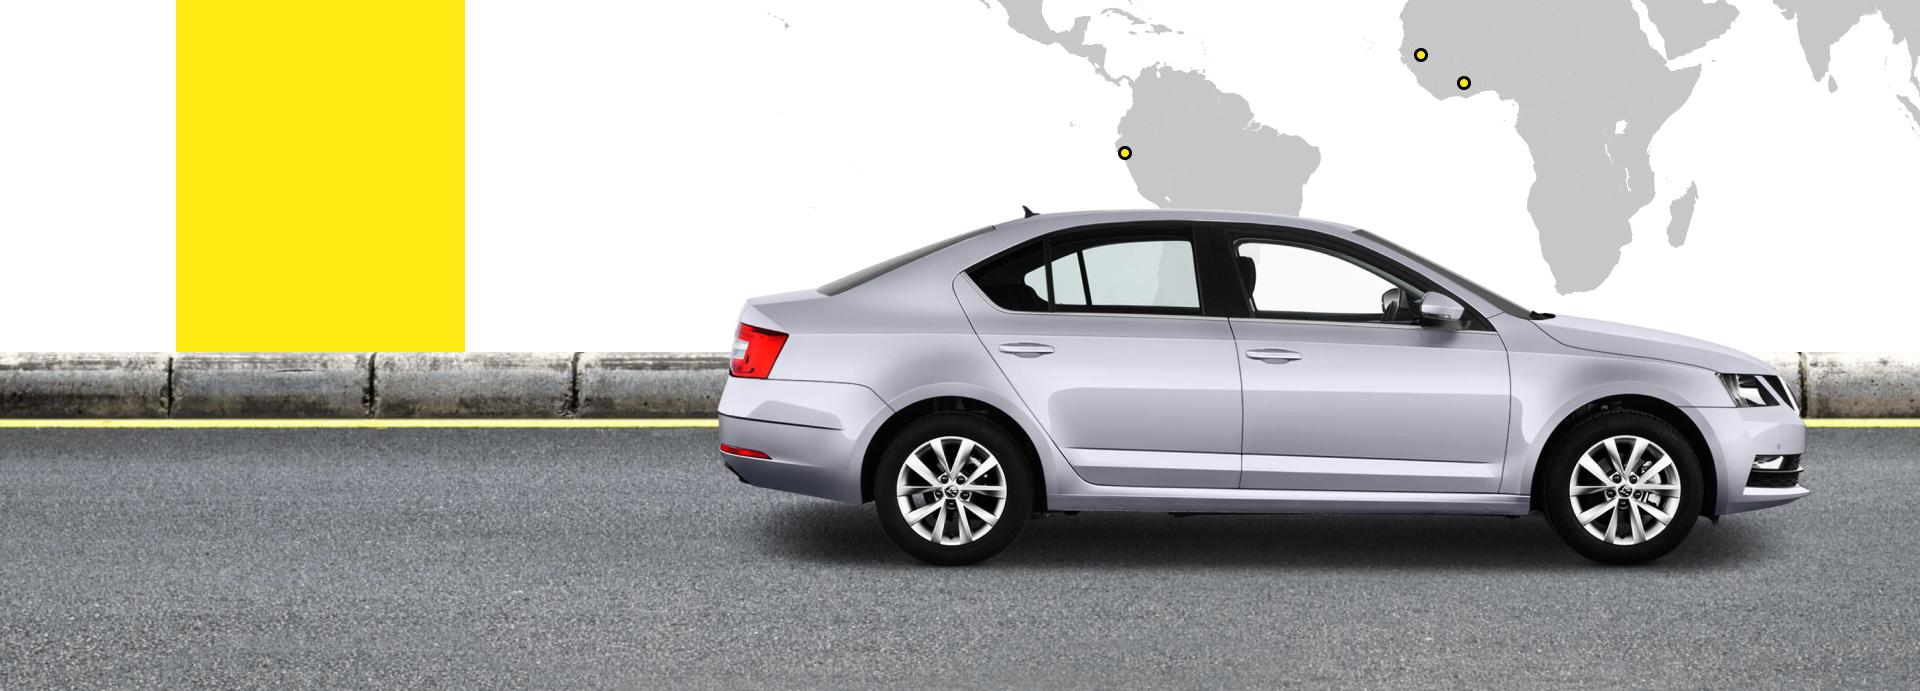
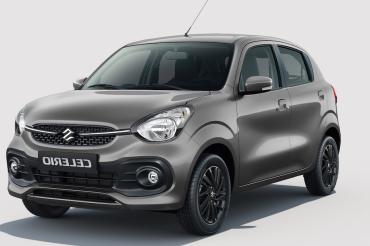
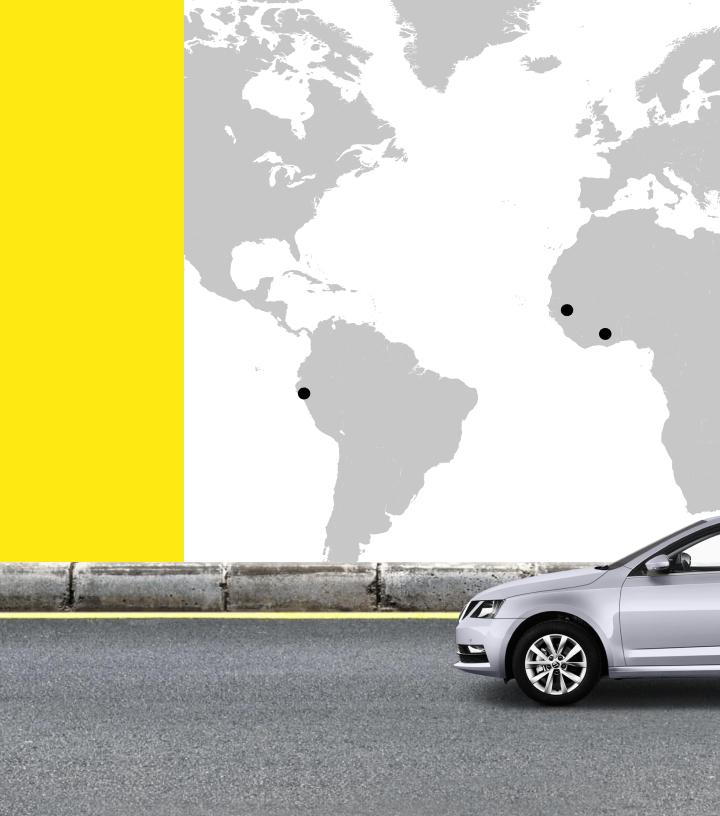
Since 2023, we've been building a bridge between aggregators, drivers, and passengers in Senegal, Ghana, and beyond. Our fleet of over 400+ vehicles operates across Africa and South America. Our philosophy is clear rates, technological control, and 24/7 support for each partner. You place your order—we provide reliable transportation.
A detailed review of the financial results of fleet management. Estimated operating profit per vehicle, payback period calculation, and total income over four years of operation.
INDICATOR | GHANA, THSD USD | SENEGAL, THSD USD | PERU, THSD USD |
RENTAL REVENUE | 7.1 | 11.6 | 8.2 |
PARTNER COMMISSION | 0.7 | 0.5 | N/A |
DIRECT COSTS | 1.9 | 2.3 | 1.4 |
CONTRIBUTION MARGIN | 5.9 | 9.8 | 6.8 |
PAYBACK PERIOD (YEARS) | 1.2 | 1.6 | 1.9 |
4-YEAR ROL, % | 332% | 255% | 226% |

Transfer of a purchased vehicle to the driver at the expense of URBAN CARS as per one of the flowcharts:

Registering drivers in the service with their own cars or a corporate fleet and ensuring the proper quality of the provided services

The dilver pays the agreed daily rental charge, additionally paying URBAN CARS a commission on each order.

The car is transferred to the driver for work The driver's salary is calculated according to the reporting day results, and the remaining funds are transferred to URBAN CARS.
The business model is based on an existing scheme in which URBAN CARS acts as a partner of leading aggregators (Ridu- Hailing services) - and provides drivers with the necessary fleet for work, registers them in aggregators as active executors of taxi orders and carries out regular supervision, hiring and ensures the work performance of the employed drivers.